MAPS FORECAST 8-10-2022 and MAPS Summary of Previous Forecasts (Ensemble Averages)
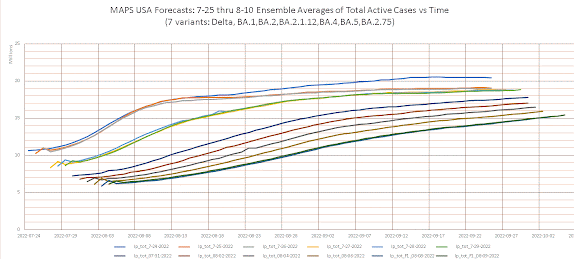
The model is again fully functional for using the CDC Vaccination Dataset. A format change cause some significant problems. The automatic download quit working and the reporting frequency changed. Water under the damn now. First, let's examine the model evolution starting 7-25 through 8-10-2022 (Dates listed are the forecast initialization date, the BA.2.75 variant has been added).
The model indicates a progression of lower domain wide initial Ensemble Average (EA) Active Case values. There are factors that influence the model. The first forecasts are early in the model learning process. At this time the individual ensemble members are weighted equally. This is influenced through the model variance and correlation to the observational data after normalization (each state is a data point). The large initial jumps are related to the CDC only reporting vaccinations weekly (started June 26, 2022). You might wonder why the difference because of vaccine data, but that is a day for another discussion (vaccine data does influence the initial state in the "spin-up" algorithm through susceptible and vaccinated efficacy numbers). Eventually the EA begins to converge. The last two forecasts are nearly identical with the last one exhibiting slightly larger initial values. The next CDC vax report will be on 8-17-2022, it will be interesting to see where that trends. The next series of forecasts will employ extrapolated vaccine data with random perturbations imposed. Hopefully the new Moderna Omicron vaccine will be rolling out soon although it was designed for the original Omicron variant and BA.2. The testing indicates a significant efficacy for BA.4 and BA.5 too. (https://www.gov.uk/government/news/first-bivalent-covid-19-booster-vaccine-approved-by-uk-medicines-regulator)
The graph also indicates a higher rate of increase for the more recent forecasts. Dr. Osterholm labeled the latest trend as a plateau in his latest podcast (https://www.cidrap.umn.edu/covid-19/podcasts-webinars/episode-110), but the plateau does have a slope. If this was on a LOG-T plot the slope would be even smaller. Overall the later forecast show an increasing trend and the this brings up many questions. First, when will it stop? We know it must reach that point, however remember we have been above 100k (my ad hoc definition of a wave) since mid-May. Second, when will the new Moderna vaccine rollout in the United States? How will it be received? Will it have a sustained efficacy above 50% for a significant period of time? More questions and suggestions will follow after we examine the latest forecast in detail.
The northeast United States is first up and will demonstrate a prevailing trend seen in other regions. Excuse the "warts" they come from the post processing program that I will fix soon. What is evident is the rapid fall in active rural cases. There are many factors in play. Most of these areas have small populations of susceptible individuals left, low population and BA.4/5 densities, and small commuting influx, to name a few.
We can see how this plays out in a largely rural state, Minnesota. Look familiar? The Twin Cities, Rochester, St. Cloud, and Duluth are the holdouts for the duration. Again, similar factors are in play. I would be negligent to not point out one caveat. I did not have the holiday/vacation superspreader algorithms on. In northern Minnesota there is a significant influx of urban population traveling to the lakes for vacation. There has been an uptick in cases in the northern counties that the model is not capturing. The same integrations with these algorithms in play will be rerun during this week. However, the impact will likely be highly transient for the previous factors I have pointed out. I have also attached some other states at the end of this writing that indicate a similar pattern of urban "confinement".
What are the connotations of the current Covid landscape? The model clearly suggests the urban "confinement" present a targeted opportunity. There are two sides of the spectrum however. The dialing back of mitigation has had its consequences. Currently the deaths are more than a 9-11 a week, while hospitals are experiencing a never ending onslaught of cases as well as staffing shortages. To ramp up mitigation strategies targeting urban areas is clearly the best option. However the dial back has made this an even tougher sell to implement for a multitude of reasons. The usual suspects, anti-vax/mask'ers will be more vocal than ever.
There are other factors at play that, and I will outline in detail in the coming days a summary and suggestions to get us to a sustainable existence with Covid (commentary on sustainability in https://jlerollblues.blogspot.com/2022/08/forecast-model-is-back-in-action-after.html). Long Covid prevalence is also presenting troubling problems, and not only financially.(https://www.politico.com/news/2022/08/14/left-to-rot-long-covid-patients-around-the-world-call-for-more-government-action-00051161)
We also have the back to school (or it could be called back to outbreak) coming (see https://jlerollblues.blogspot.com/2022/08/this-from-expert-cdc-mouthpiece.html). We have dialed back the mitigation strategies for public schools to. Adequate air filtration are lagging (about our infrastructure bellis, what's in them for this) for schools not to mention businesses. Meanwhile we go full throttle in accepting the situation as the new normal. Here is an interesting not from South Korea on mitigation and timing to supplement the blog (https://jamanetwork.com/journals/jamanetworkopen/fullarticle/2795165)
Look for more tomorrow. Over the rest of the week I will examine a sensitivity study with the vacation/holiday spreader algorithms and another with mitigation strategies cranked up targeting urban populations. In addition, a new forecast tomorrow and Thursday. I am also working on adding MPX but our learning curve is still quite sharp on this. Just the other day we of a human->dog transmission verified with a DNA test. And with ~76% of our population up to date on basic public vaccinations what will polio add?
And a quick ask: I desperately need a GIS person to digitize county/state/province FIPS codes onto my ~1km gridded mesh. This will enable the model to ingest county level data and help improve the forecast in rural areas. It should be a project measured in a few hours. I have FIPS map files in GIS format and downloaded free GIS software. I have not had time to play with it unfortunately. Since I am doing this work for free about all I can pay is a co-authorship on a publication and time on my server if needed.
Please feel free to add comments like possible sensitivity scenarios you would like to see. I would like to see this run globally essentially forming a closed system. It has been done in the past, just so many hours in the day though.
Take care,
Joe
@jlrollblues
https://jlerollblues.blogspot.com
- Get vaccinated
- Wear
a mask that covers your nose and mouth
- Get
tested when sick
- Wash hands often
- Stay >10 feet from others
- Stay home when sick
- Work from home when able
- quarantine if infected 11 days
- Dine outside at restaurants if possible, if not mask when possible and inquire about their air exchange
- If servers aren't wearing masks try another establishment or order out
For questions related to the COVID-19 pandemic,
call 1-833-431-2053, Monday-Friday, 9:00 a.m. to 7:00 p.m. and Saturdays 10am –
6pm.
Monkeypox (MPX) transmission routes:
Intravenous
Oral
Intranasal
Inhalation / aerosol in primates
Intradermal
Cutaneous
Pets?


OK, target with masks/distancing and then go in for a severe kick in Covids teeth: Coronavirus vaccine maker Pfizer and its German partner, BioNTech, submitted an application Monday to the Food and Drug Administration for emergency use authorization for a new coronavirus booster.. This baby will target BA.4/5!
ReplyDelete